STAR PLUS
A role-based astronaut health dashboard for NASA Space Apps Challenge 2026.
- Role
- Full-stack developer & 3D interface
- Stack
- 9 tools
Overview
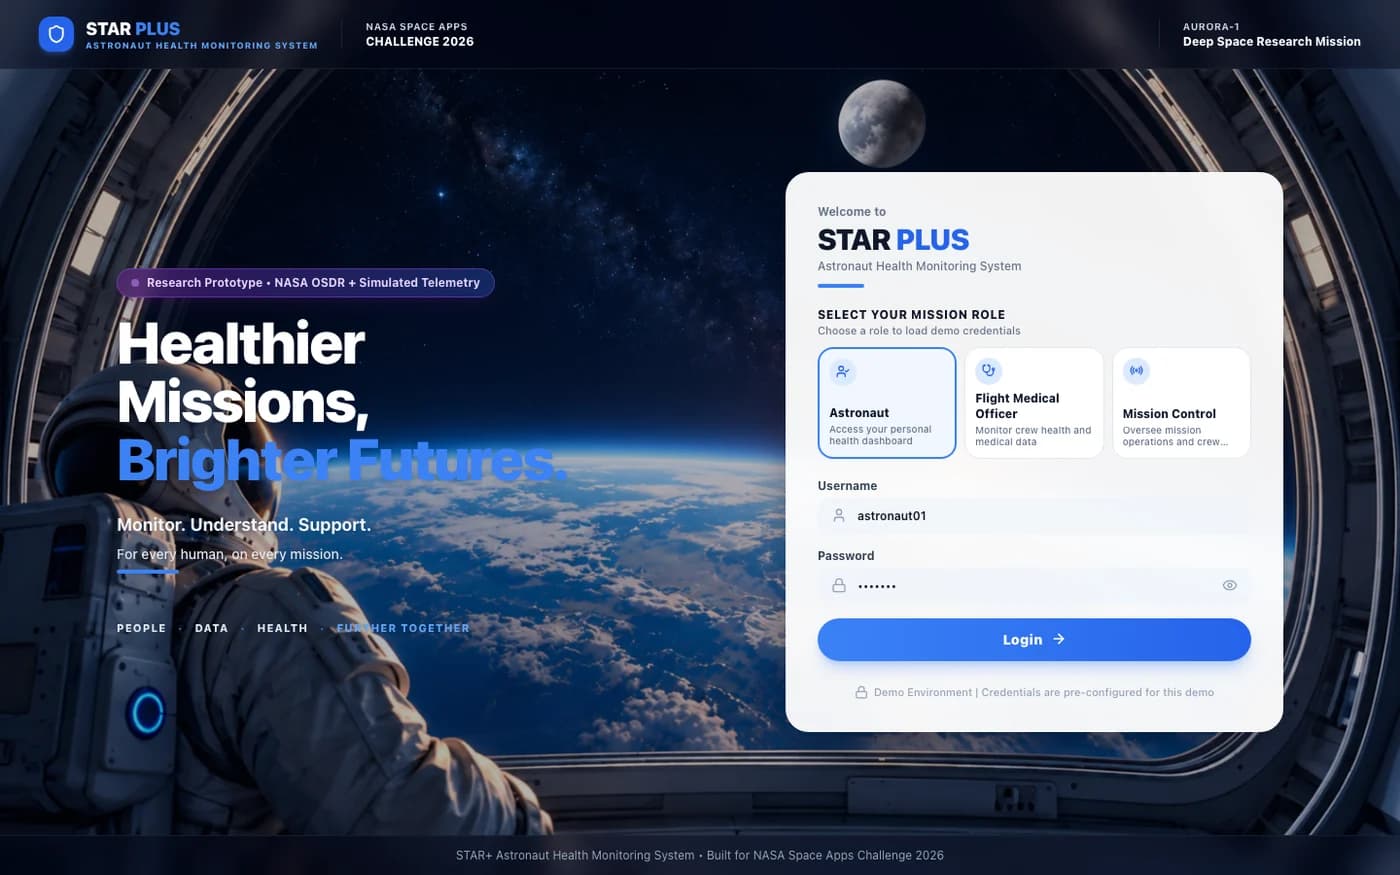
STAR PLUS — Space Telemetry & Astronaut Recovery Physiological Long-term Unobtrusive System — turns dense physiological and environmental telemetry into a mission-ready dashboard. Three roles see the same mission through different lenses: an astronaut's personal health portal, a flight medical officer's triage view, and mission control's operational picture.
The problem
Long-duration spaceflight produces a firehose of biometric and environmental data. The hard part is not displaying it; it is helping a crew member or medical officer understand what changed, why it matters, and what to do next. A dashboard that only shows numbers pushes that interpretation back onto the busiest person in the room.
What I built
The product, piece by piece.
- 01
Three role-based portals
Astronaut, Flight Medical Officer and Mission Control each get a focused view of the same underlying mission, with demo credentials for exploring the prototype.
- 02
Baselines and a 72-hour window
Vitals are compared against a 30-day personal baseline while a 72-hour moving window looks for early deviations in sleep, resting heart rate, stress, exercise and reaction time.
- 03
Explainable WATCH signals
Every flagged signal opens a 'Why was this flagged?' view with raw values, percentage change, contributing operational factors and deterministic intervention guidance.
- 04
Environmental telemetry
Mission Control can monitor ECLSS cabin conditions and simulate CO₂, temperature and radiation anomalies to see how the system responds.
- 05
3D digital twin
A Three.js/WebGL scene gives the mission a spatial layer — the Space Shuttle Discovery and anatomical organ views alongside the charts.
- 06
Honest demo boundaries
All crew vitals and environmental data are synthetic, and the interface says so. The product is a research prototype, not a clinical device.
The hard parts
Challenges & decisions.
Explainable rules, not a black box
The clinical story only works if a medical officer can audit it. I kept the baseline and deviation logic deterministic, then designed a modal that exposes the raw measurement, the percentage shift, the contributing factors and the recommended next step.
Two rendering worlds in one app
Recharts handles the dense time-series views while Three.js handles the digital twin. Keeping both performant meant lazy-loading the 3D scene, pausing work when it is off-screen, and avoiding hydration mismatches in charts that depend on measured widths.
Roles on the edge
The app targets Cloudflare Workers with a static export. Role-based demo access, protected views and route transitions had to work without a traditional always-on server, while remaining easy for judges to try.
Dense data, calm interface
WATCH states need to be legible without relying on colour alone. The telemetry views combine labels, icons, ordered hierarchy and responsive charts so the dashboard still reads on a laptop during a demo.
What's next
Potential improvements.
- Ingest real NASA OSDR data with clear provenance and dataset versioning.
- Put the thresholds and intervention rules through a clinical review process.
- Add ML anomaly detection alongside the deterministic rules — with explanations, not instead of them.
- Introduce audit logging and real role permissions before any clinical pilot.
- Design a mobile-first telemetry view for crew members away from a console.
- Publish a transparent methodology page for the baseline and WATCH logic.